Sensory Research Context
How to describe the sensory profile of food, beverages, and cosmetics quickly and intuitively.
Sensory methodology created and designed by Dr. Thuillier (ABT Informatique)
White paper authored by Dr. Thuillier
Translated by Karine Lawrence (Sirocco Consulting)
1. How to Describe the Sensory Profile of Complex Food, Beverages and Cosmetics
How to describe the sensory profile of wine and identify differences amongst vintages?
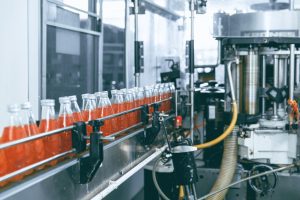
What are the top sensory descriptors for different lots of orange juice and what is the source of the
variation?
What are the main sensory characteristics of a cosmetic after skin application and how does the scent
evolve over time?
Which cultured yeasts to use when making artisanal bread in order to deliver the best sensory profile to
prospective consumers?
The sensory scientist often asks these questions when establishing the scope of a sensory project. In addition, how many sensory descriptors should one target? Should experts be recruited over novice sensory panellists? Should experts be trained? How can R&D departments collect detailed and accurate sensory data in a way to capture the best sensory insights?
When considering the involvement of panellists, how can assessors provide feedback if the sensory ballot is too restrictive or if the sensory method is too directed? How do they complete a study if the number of samples is too high leading to sensory fatigue? How can they ensure that, when assessing 30 wine or coffee samples, the first sample will be evaluated with the same rigour as the last sample? ‘
The Pivot© Sensory Test was born out of these considerations and is the result of our experimental research. Our intimate knowledge of the traditional method — the sommelier-type method — led us to consider its strengths and weaknesses to offer a new and innovative method for sensory profiling.
2. Limitations of QDA
The goal of sensory analysis has always focused on accurately measuring panellists’ responses. Training panels extensively on validated sensory profiling methods would be a pre-requisite. Experiments would be repeated in order to assess statistically the performance of the panel.
The tenets of QDA are such that the sensory panel must reach a consensus. Their objective is to identify a list of sensory descriptors (around 20 or 30 attributes generally) which they will be trained to recognize, identify and quantify. This process requires the use of easy-to-grasp descriptors on which panellists must be trained by using sensory references. For instance, panellists can estimate the acidity of an orange juice by conducting repeated sensory tastings of low and high acidity reference samples spiked with known concentrations of citric acid.
Although rigorous, the QDA method presents weaknesses:
Training: is long and extensive and does not always reach the desired outcome. Panellists must make a considerable time commitment. Due to the need for consensus, the level of discrimination for certain descriptors, even after extensive training, may not be high enough to provide an accurate measurement and product differentiation. In some cases, outlier panellists must be removed from the panel after the sensory training is validated which will reduce the number of sensory responses.
- Panellist’s variability: Attribute means and standard deviations for the panel may not be representative of the full sensory information captured by all panellists. In QDA, intensity scores are averaged and the panel means are considered the true sensory measurements.
- Data exhaustivity: The QDA method restricts the number of descriptors to the list obtained by consensus. Additional and pertinent information that panellists may want to express will not be captured and reported. In this regard, the sensory profile will not be exhaustive.
- Sensory fatigue: Finally, the intensity scale training protocol in QDA relies on memorization. Repeated sensory training sessions lead to fatigue and a decrease in data precision.
- In light of these observations, it appears that a free comment method would be best suited for descriptive profiling of foods and cosmetics.
3. What is the Traditional Method?
Traditionally, sensory evaluation involved asking a few experts for their feedback using free sensory descriptions. Historically, a complex beverage such as wine was often evaluated by experts this way. This free comment method was closest to the sensory perceptions of individual panelist. However, this information proved difficult to calibrate.
This classic method is also not amenable to modern quality control or R&D. Indeed, the free comment method is very hard to communicate and quantify when dealing with customers and producers.
4. A novel approach with clear objectives and constraints
Free comments expression
The profiling method relies on free comment description as a way to capture mono-dimensional sensory information from individual panellists. Experts use their own language to describe a product that plays to their strengths as sensory assessors.
Paired product comparisons
Categorical data is used as an ordering technique for the panellists to place the product in the sensory space. Paired comparisons are preferred in the sense that such comparisons prevent sensory fatigue.
Clear objectives and constraints
The profiling method is designed to easily describe and differentiate amongst products with complex sensory attributes. The method is framed by the following objectives and challenges.
Data collection objectives:
- Measuring temporal sensory perceptions to provide added value to the industry by establishing the sensory profile of consumer products for specific timeframes or stages of application (cosmetics) of consumption (food and beverages).
- Taking into account individual perceptions through free comments expression.
- Capturing information quickly from each panellist (no need for calibration training using intensity scales and references)
- Performing paired product comparisons to identify differences intuitively and reduce fatigue.
- Assessing judges’ acuity and knowledge by reviewing the quality of the free comments.
Challenges:
Enabling the data processing and statistical graphing and reporting from qualitative data through the use of Tastelweb© software
Offering a method that does not require sensory training by offering an intuitive method which uses free comments description
Limiting the number of product comparisons allowing competitive and feasible sensory assessments (no sensory fatigue)
While some traditional food products and cosmetics are amenable to sensory evaluation (shampoo, perfume, tea, coffee, wine, chocolate), the de-categorization of complex food products and cosmetics is creating a need for sensory profiling (ex: cannabis edibles in Canada and some US States, wine cocktails, nitro beverages or mood-altering cosmetics).
Introducing the « Pivot© Profile » Method
This approach led us to develop the novel Pivot© Profile Test Method, which preserves panellists’ rich information by capturing categorical data using free comments.
This sensory method is based on a series of paired comparison tests where individual samples are assessed against a “Pivot” sample. Assessors are required to evaluate, without limitations, the sensory profiles of products and compare them to the Pivot sample by identifying which perceptions are less or more intense than that of the pivot. This method allows us to capture insightful information and to draw on the lexicon and knowledge of the assessor.
1. Products.
All samples are evaluated by pairs against the pivot sample. As a result, the evaluation of 5 samples will require 5 consecutive and random paired comparison tests with the pivot sample.
Choice of Pivot Sample
The Pivot sample represents the average sample for the sensory space. It can be a commercial standard for quality control purposes or a mixture in equal measure of the evaluated samples if in powder or liquid form. This is ideal for spice blends, beverages and perfumes.
If evaluating 30 or more products, requiring multiple sessions, the pivot sample will need to be stable and constant for an accurate evaluation over time.
Evaluated Products
Two products, at a minimum, can be compared. In such a study, each sample will act as the pivot in two distinct tests to aim for a symmetrical evaluation.
A maximum of 100 to 200 products can be considered. Assuming a stable and constant pivot sample, paired comparisons can be staged so that a large number of samples can be assessed while preventing sensory fatigue.
Products that evolve over time (such as warm or melting food, foods losing their textures over time, volatile cosmetics and carbonated beverages) but also olfactively complex products, blended products or similar products from different lots assessed for quality control can be assessed using the pivot method.
2. Panellists
With this new sensory method, panel training is not required.
When using expert panellists, sensory data will allow description and comparison amongst products using precise and rich descriptive terms.
When using consumers, sensory profiling will highlight hedonic descriptions of the consumer goods or characteristics pertaining to the everyday use of the products.
The number of participants is important for the test to have statistical power. A minimum of 7 to 10 responses from experts is recommended to analyze frequency distributions.
Unlike QDA, panel performance and alignment pose no constraint. On the contrary, panel heterogeneity is encouraged as contributing to the robustness of the results.
3. Serving Order
Samples are presented in pairs to promote a direct comparison of the pivot and the sample under study. Paired tests follow a randomised serving order to prevent bias. Panellists are allowed to rest between pairs of samples, until all have been evaluated against the pivot sample. The panel coordinator should restrict the number of paired comparisons per session to prevent sensory fatigue.
Evaluation time must take into account the dynamic evolution of the samples to collect complete sensory descriptions. For instance, for beverages such as teas and coffees, the tests include assessment during cooling and re-heating. For sparkling wines, the phase of degassing should be considered; for this sort of product, we have conducted 90-minute sessions where individual paired comparison tests would last 8 minutes followed by a 1-or 2-minute rest between tests. When the temporal assessment of stable products is not required, evaluation time can be divided by a factor of three. It is therefore suggested to evaluate a maximum of 30 to 50 pairs of samples per session, allowing the evaluation of 30 to 50 products.
4. The Sample Evaluation
Based on the products, the sensory analysis may follow a multi-phase approach that will rely on all senses. When tasting wine, the phases of sensory evaluation comprise sensory descriptions made of attributes and prototypes, which are temporarily observed:
- First phase, appearance is a visual assessment of the colour and opacity of the wine;
- Second phase, aroma, is based on a direct olfactory assessment;
- Third phase, taste, comprises flavour, texture and gustative evaluation including retro-nasal olfaction;
- Last phase, finish, is based on gustative and retro-nasal assessment of the wine after expectoration.
An overall assessment phase can be added to the evaluation to capture hedonic or prototypic descriptions.
This method of evaluating samples is close to how a consumer or expert would evaluate a product to form a judgement about its quality or a sensory description. We could also say that it is close to how perception operates in sensory physiology. The detection of a stimulus is formed by sensing a contrast at the level of the sensory receptors.
The method is also considerably faster than a QDA assessment for the same number of samples.
5. Data Collection.
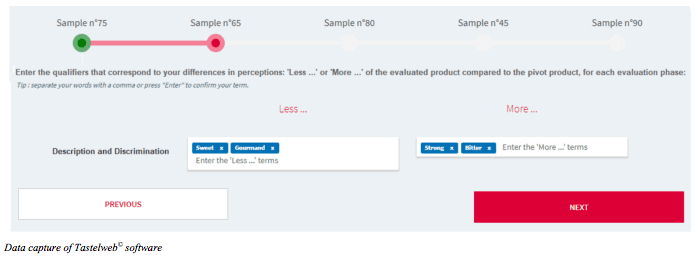
Data entry for each product comprises two steps to identify differences in perception between the studied sample and the pivot sample. Panellists key in qualitative descriptors of the sample which are perceived as more intense than in the pivot sample. They then enter qualitative descriptors of the sample which are perceived as less intense than in the pivot sample.
The qualitative descriptions include prototypes or attributes.
Prototypic descriptions refer to objects connected with a sensory reference such as « camphor-like », «orangey» or « robust » to describe the smell of camphor, the colour of an orange or the strength of coffee.
Qualitative descriptions are also permitted such as « smooth », « translucent », « viscous » and so on.
The panellists can also use qualitative expressions such as “green shimmers”, “ripe fruit”, “fine bubbles.” On the other hand, negative expressions are not allowed. It is recommended to use the positive term such as “still” for “non-effervescent”, “dark” for “not light coloured”. Due to the automated treatment of the information, verbs, conjunctions and articles are also not permitted.
A sensory ballot is represented below:
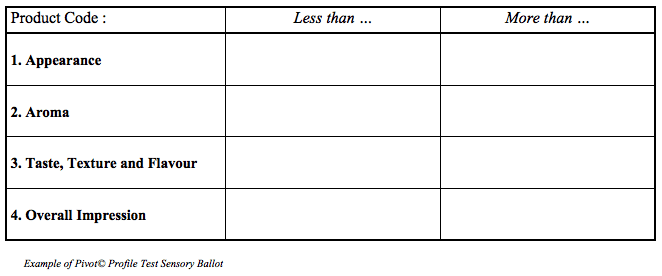
When using Tastelweb© software, the data entry can be presented as follows:
6. Data Analysis
Based on project objectives, data analysis can be used to generate broad product descriptions and detailed analyses of products and panellists.
1. Descriptor Count
For all products and for all entries, an automatic count of sensory descriptors (attributes, qualitative expressions and descriptors) produces a list of descriptor frequencies in decreasing order.
2. Grids of Antonyms and Synonyms
Because panellists use their own lexicons, different qualitative descriptors express the same perception. Errors in spelling or the use of antonyms (« dark » and «lighter colour or less colour») will require grouping certain terms. The resulting grids of descriptors can then be used as training aids.
The grouping of similar terms under a generic descriptor will facilitate the discrimination amongst products and better product characterization. Synonyms and antonyms may be generic but must be made specific to a dynamic evaluation phase for the category of products under study.
3. Counting of Descriptors “Less than” et “More than” Per Product or Panellist
After these groupings are made, the next step will consist in selecting the descriptors with the highest frequencies for products or panellists. This is required to differentiate products or panellists.
Generally speaking, and for a small panel of 10 assessors, the descriptors must display a frequency at least equal to the number of products (5 products, selected descriptors must have a frequency of 5). When dealing with larger panels and for the evaluation of 5 products, the frequency for the selected descriptors must be multiplied by a factor corresponding to the number of panellists divided by 10. For instance, a 30 person panel will require selecting descriptors with frequencies of 5 X 3 = 15.
The subtraction of frequencies for ‘Less than’ from the ‘More than’ frequencies will produce a gradient of comparison for each qualitative descriptor and for each product compared to the pivot sample. To avoid displaying negative frequencies, a general shift of scale will be made by taking the absolute value for the maximum negative difference between frequencies and adding it to all values.
This operation will produce, at the panel level, a scale with a strong range or a gradient with a strong resolution of values for each product and each of the attributes. These data manipulations transform a collection of open qualitative data into a very fine quantitative measurement of the products on all of their sensory characteristics.
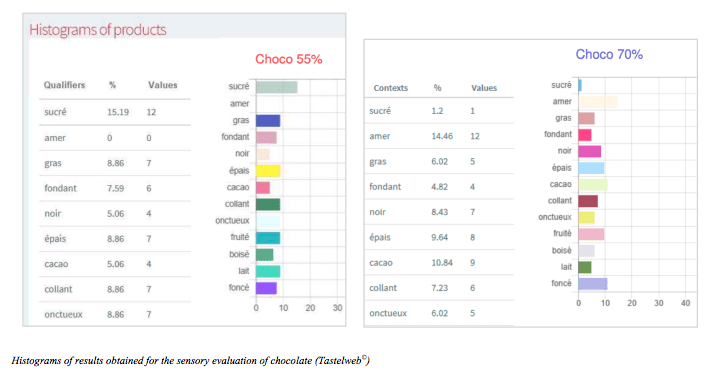
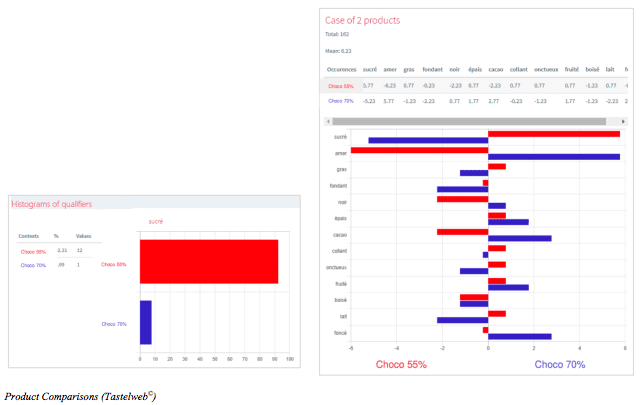
4. Data Reporting and Graphing
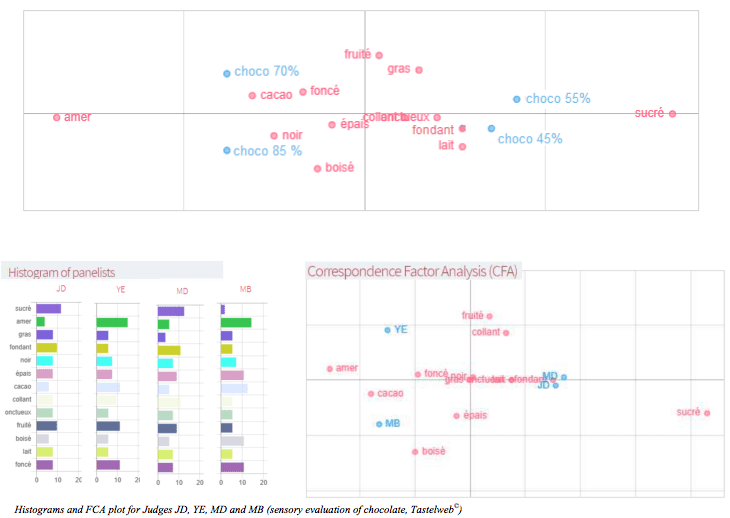
The results are then reported by phase or combined phases using frequency histograms or a Correspondence Factor Analyse (CFA).
Sensory profiling of products can be shown by descriptor for all products or by product for all descriptors.
Similarly, the panel characteristics (experts or consumers) can be analyzed by using the frequencies obtained per panellist, or in a transposed manner by the descriptor.
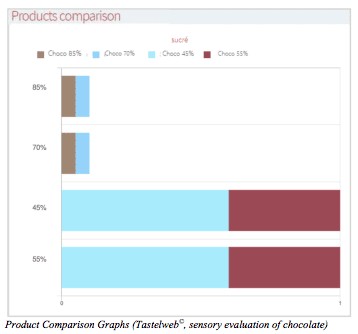
5. Product Comparison Tests
The original results obtained for the panel will be used to compile product comparison tests. This will be done by using values by a descriptor and by panellists according to the occurrence of their citations.
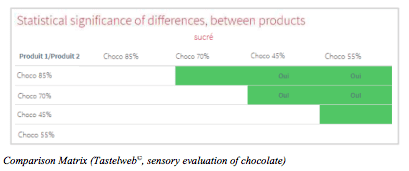
These tests can be based on pairwise hypothesis tests (Student’s tests), by examining all the combinations of product comparisons in order to produce graphical representations of these differences, and significance matrices, as shown below:
Perspectives
1. Final Thoughts
Our experimental research led us to consider the collection of free comment descriptions as the best-suited method to capture experts’ sensory data. However, processing free text comments proved very difficult and resulted in us having to compare two products by manipulating the sensory information obtained from panellists. Indeed, the data manipulation allowed us to move from categorical data and ordinal information to a measurement on a scale. This strategy resulted in an increase of the signal over noise without loss of expression from the panel.
We should also mention that during the sensory evaluation, the panel was not in a process of conscious reflection which could be restrictive and lead to pre-conceived patterns and expected results. Instead, the panel expression was natural and spontaneous, as we initially intended. In this regard, we do not recommend providing assessors with lists of attributes ahead of the evaluation as it may bias the spontaneous expression of sensory perceptions.
2. Applications
The ability of the Pivot© Profile Test to use free comment descriptions in sensory testing can be applied beyond the field of descriptive analysis such as in quality control, consumer testing or to detect counterfeited products. It can also be used in conjunction with analytical measurements to gain more sensory insights and help with troubleshooting sensory defects and deviations in sensory profile.
Correlation With Analytical Measurements.
Pivot© Profile Test sensory data can be correlated to the physicochemical properties of food, beverages or beauty products. For food applications, comparing sensory information to analytical measurements of soluble and sapid molecules, volatile or texture compounds (such as sugar, salt, acid, amino acid, lipid and protein values) would enable R&D teams to understand a product’s
intrinsic characteristics better and anticipate a loss of product quality or functionality.
Quality Control (QC)
The Pivot© sample can be easily substituted with a standard reference for quality control purposes. This is because the pivot sample always represents a sample of average intensity and profile.
In the case of consumer products, products from different manufactured lots are compared to a standard to ensure consistency in sensory profile. The Pivot© profile test then allows Quality Control Departments to perform lot approvals against established specifications. Analytical tests can be used to investigate and troubleshoot sources of sensory variation. The Pivot© profile test can also enable shelf-life studies or claims that a food will meet specifications at the end of its expiry date. For such an experiment, the panel coordinator will choose a Pivot sample that is neutral or a combination of the assessed samples.
Counterfeiting
In perfumery, the cost of analytical measurements to detect counterfeited perfumes can be prohibitive. The Pivot© sensory test can provide a faster alternative to highlighting and characterizing
significant olfactory differences with the standard perfume. Experiments show that counterfeit perfumes with simplistic sensory profiles can easily be identified when compared with branded perfumes with lasting and complex scents. In the food and beverage sector, this test could be applied to extra virgin olive oil and honey, both of which are subject to extensive fraud for economic gain. In this case, the Pivot sample can be the market leader or branded reference for the sensory test.
Consumer Tests
The Pivot© Profile test was initially created to generate sensory profiles of food and cosmetics by expert assessors but the methodology can also be applied to consumer tests when product
acceptance and preference are sought after. The pivot sample can be, in this case, a neutral commercial reference or a market leader. The objective of the sensory test is therefore to match the market leader.
Since the Pivot© Profile test takes into account differences amongst panellists, it is well suited for hedonic evaluations by consumers where variations between tasters are even more pronounced. When undertaking such assessments, the consumer insights professionals would seek faults and positive product characteristics.
In summary, The Pivot© Profile test provides an ideal solution for quick and exhaustive consumer tests. The method allows the rapid collection of consumer insights with immediate data analysis, graphing and reporting capability. The tool is well suited for online surveys where 100 to 200 consumer responses are required for statistical and cluster analysis.
Bibliography
- PhD Thesis, Bertrand Thuillier (2007:Role of CO2 in the organoleptic evaluation of French champagne – Experimentation and methodology – URCA Reims (France).
- Pivot profile©: A new descriptive method based on free description. Bertrand Thuillier – Food Quality and Preference (2015).
- Evaluation of the Pivot Profile©, a new method to characterize a large variety of a single product: Case study on honeys from around the world Pascale Deneulin – Food Quality and Preference (2018).
- AWRI using new technique for sensory analysis / Wine Australia (2018).
- Novel and successful free comments methods for sensory characterization of chocolate ice cream: A comparative study between pivot profile and comment analysis – Fernando G.A. Fonseca – J. Dairy Sci. 99: 3408-3420 (2016).
Bertrand Thuillier is a researcher, university professor and CEO of ABT informatique.
ABT informatique commercialises the Tastelweb© sensory application.
ABT Informatique : 5, rue du Château – 52300 – Rouvroy-sur-Marne – France
Karine Lawrence, Founder and Principal Consultant