When conducting descriptive sensory assessments of food and beverages, the panel coordinator must monitor the performance of the panel to ensure the accuracy of the data and, in some cases, schedule retraining on specific sensory descriptors.
To review the performance of the panel and panelists has three objectives:
- Assessment of the overall panel performance and that of individual panelists in terms of sensory acuity, the understanding of sensory attributes, and the alignment of panelists.
- Reporting accurate product descriptions (understanding who in the panel over- or under-evaluates certain attributes; when needed, removing outliers to produce more nuanced product descriptions).
- Monitoring performance over multiple tastings to determine panelists’ reproducibility to develop a training plan for the sensory panel.
We will use a teaching sensory dataset as an example to demonstrate how metrics can be used to define panel performance. Wine students were introduced to sensory profiling (QDA® methodology) as part of a sensory evaluation course for wine and spirits. Tastelweb software was used to capture the sensory data. Three red wines were evaluated blind using linear scales. Sixteen (16) descriptors were rated using intensity scales, in which a score of “0” indicated no intensity and “10” indicated very high intensity for the studied descriptor.
Calibration and Consensus
A review of Principal Component Plots (PCA) for the panel and products provides some insights as to how the descriptors are understood by the panel and whether the judges were discriminant and aligned in their scoring of attributes.
A PCA plot is a graphical tool that allows projecting on 2 or 3 dimensions most of the information (variance) contained in a dataset. The panel coordinator can thereby synthesize a large amount of information into a visual format. The graph shows how panelists, descriptors, and projects are aligned and correlated.

In Figure 1, nine (9) judges are represented alongside 16 wine sensory attributes. Judge 9 is closest to the center of the PCA plot so captures the consensus of the sensory response. His ratings are aligned with the panel results (characterized by the center of the plot). Judges on the outside of the plot (i.e; judges 3, 5, and 6) are far from the panel mean and need recalibrating. A look at correlation coefficients (see example below) for the panel can provide information on the way panelists score products. In Figure 1, judges 7 and 8 are close to each other in the plot so their performances correlate positively. In comparison, Judge 3 and Judge 6 are polar opposites so are negatively correlated.

The sensory panel coordinator can review standard deviations and coefficients of variation per descriptors to obtain information on the performance of the panel. A review of Table 1 shows large standard deviations for individual descriptors for all wines. As explained previously, the panel is untrained but familiar with the product space. Panelists would require training on using the intensity scales so that tighter attribute scores with low standard deviations could be obtained. In practice and considering QDA®, a professional panel would be expecting to meet the following targets:
Tastelweb Sensory Tests
Standard Deviations for a Professional Sensory Panel
Between 0-0.5 – Excellent performance
Between 0.5 and 1 – Average to Good
Above 1 – Retrain the Panel
With the coefficients of variation (see Table 2), the panel coordinator has access to more robust metrics to evaluate performance. Coefficients are calculated by dividing standard deviations for individual descriptors by the panel mean. The spread of the data on low-intensity scores as well as on high-intensity scores can therefore be taken into account. We see that although the standard deviations are high, the panel has nonetheless a good comprehension of some attributes and is able to score low-intensity and high-intensity descriptors with some level of alignment. One such attribute is the berry flavor for Cab Merlot (2018). The low coefficient of variation (0.33) translates into a cluster of judges on the PCA plot (see Figure 2) for this attribute.
Coefficients of Variation for a Professional Sensory Panel
Between 0.2-0.25 – Excellent performance
Between 0.2 and 0.5 – Average to Good
Above 0.5 – Retrain the Panel
Once the overall panel performance trends are identified, a detailed look at individual panelists can provide more information about their acuity/calibration for certain descriptors. A look at the sum of negative and positive differences versus panel (see Table 3) as well as total deviations provides clues as to the judges that are outliers. They may overrate and/or under-evaluate descriptors. In the example below, all judges show a large score deviation from the panel. Judge Iris tends to be an outlier since her scores are farthest away from that of the panel. Karl’s scores are more in line with the panel, yet he tends to use the higher end of the scale (large positive difference). When training a sensory panel, the goal is to reduce the score variations to “0”.
Calibration of panelists
Table 1 – Standard deviations of panel calibration
| Cabernet Merlot (2018) | Syrah (2018) | Cabernet Franc (2017) | Total | |
| Berry Aroma | 2.16 | 1.99 | 1.66 | 1.94 |
| Cassis Aroma | 2.33 | 1.68 | 2.61 | 2.21 |
| Spicy Aroma | 2.25 | 1.71 | 2.07 | 2.01 |
| Vegetal/herbal Aroma | 1.97 | 2.06 | 2.53 | 2.19 |
| Vegetative Aroma | 1.91 | 1.92 | 2.38 | 2.07 |
| Green bell Pepper Aroma | 2.18 | 1.72 | 2.61 | 2.17 |
| Oak Aroma | 3.15 | 1.74 | 2.42 | 2.44 |
| Acidity | 2.76 | 2.81 | 2.14 | 2.57 |
| Astringency | 2.55 | 2.05 | 1.67 | 2.09 |
| Taint/off- flavour | 1.02 | 3.16 | 1.93 | 2.04 |
| Bitterness | 2.16 | 3.11 | 2.92 | 2.73 |
| Berry Flavour | 1.69 | 1.87 | 2.71 | 2.09 |
| Oak Flavour | 1.93 | 0.99 | 2.36 | 1.76 |
| Length of Finish | 1.69 | 2.76 | 1.69 | 2.05 |
| Mouthfeel | 2.26 | 2.81 | 2.41 | 2.49 |
| Balance | 1.54 | 3.13 | 2.42 | 2.36 |
Table 2- Coefficients of variation of panel calibration
| Cabernet Merlot (2018) | Syrah (2018) | Cabernet Franc (2017) | Total | |
| Berry Aroma | 0.42 | 0.50 | 0.49 | 0.47 |
| Cassis Aroma | 0.66 | 0.67 | 0.61 | 0.64 |
| Spicy Aroma | 0.60 | 0.34 | 0.49 | 0.47 |
| Vegetal/herbal Aroma | 1.06 | 0.80 | 0.80 | 0.89 |
| Vegetative Aroma | 1.30 | 1.03 | 0.89 | 1.07 |
| Green bell Pepper Aroma | 1.46 | 0.70 | 0.78 | 0.98 |
| Oak Aroma | 0.83 | 0.30 | 0.47 | 0.53 |
| Acidity | 0.57 | 0.79 | 0.72 | 0.69 |
| Astringency | 0.53 | 0.40 | 0.31 | 0.41 |
| Taint/off- flavour | 1.14 | 1.00 | 1.35 | 1.16 |
| Bitterness | 0.61 | 0.76 | 0.93 | 0.77 |
| Berry Flavour | 0.33 | 0.58 | 0.87 | 0.59 |
| Oak Flavour | 0.51 | 0.16 | 0.46 | 0.38 |
| Length of Finish | 0.34 | 0.63 | 0.33 | 0.43 |
| Mouthfeel | 0.50 | 0.69 | 0.65 | 0.61 |
| Balance | 0.28 | 0.82 | 0.54 | 0.55 |
Table 3 – GENERAL RESULTS: Results of panelists’ evaluations
| Panelist reference | Number of tests | Attendance | Sum of negative
differences / panel |
Sum of positive
differences / panel |
Deviation
versus panel |
Total deviations |
| John | 1 | 1.00 | -18.77 | 2.98 | -15.78 | 21.75 |
| Karl | 1 | 1.00 | -6.19 | 17.96 | 11.77 | 24.15 |
| Anna | 1 | 1.00 | -16.93 | 9.04 | -7.88 | 25.97 |
| Chris | 1 | 1.00 | -16.70 | 9.41 | -7.28 | 26.11 |
| Iris | 1 | 1.00 | -20.42 | 15.51 | -4.90 | 35.93 |


By reviewing the product PCA plots as well as the ANOVA data relating to product comparisons (Fisher’s Least Square Differences), we can confirm that the panel is discriminant for a number of significant attributes (computed at p value =< 0.05): Berry flavor (See coefficient of variation for cab merlot (2018) in Table 2 and Figure 2 and 3) but also acidity and taint/defect (data not shown). Overall, the dataset also shows good panel alignment for berry and spicy aroma, astringency, oak flavor, and length of finish (see coefficients of variation in Table 2). The student panel is knowledgeable about the product space (red wine) but still requires calibration to rate products in a similar fashion. Better alignment will lead to more differentiation between the products. In turn, product sensory profiles will be more detailed.
Table 4- RATING DETAILS: (Deviations, mean of results per descriptor)
Berry Aroma Oak Aroma Vegetal Aroma
| Panelist reference | Negative deviation mean | Positive deviation mean | Negative deviation mean | Positive deviation mean | Negative deviation mean | Positive deviation mean | |
| Judge 1 | 0.00 | 0.84 | -0.60 | 0.81 | -1.26 | 0.24 | |
| Judge 2 | -0.69 | 1.03 | -0.40 | 1.08 | -0.64 | 0.59 | |
| Judge 3 | -0.99 | 1.00 | -1.27 | 0.15 | -2.19 | 0.00 | |
| Judge 4 | -1.04 | 1.31 | -1.19 | 1.03 | -1.32 | 2.14 |
Looking at the score deviation means for individual judges and for each descriptor (Table 4), we can pinpoint which attributes are over and under-evaluated by specific judges in comparison to the panel. In the above table, Judge 3 underrates the vegetal aroma of wine while Judge 4 over-evaluates it.
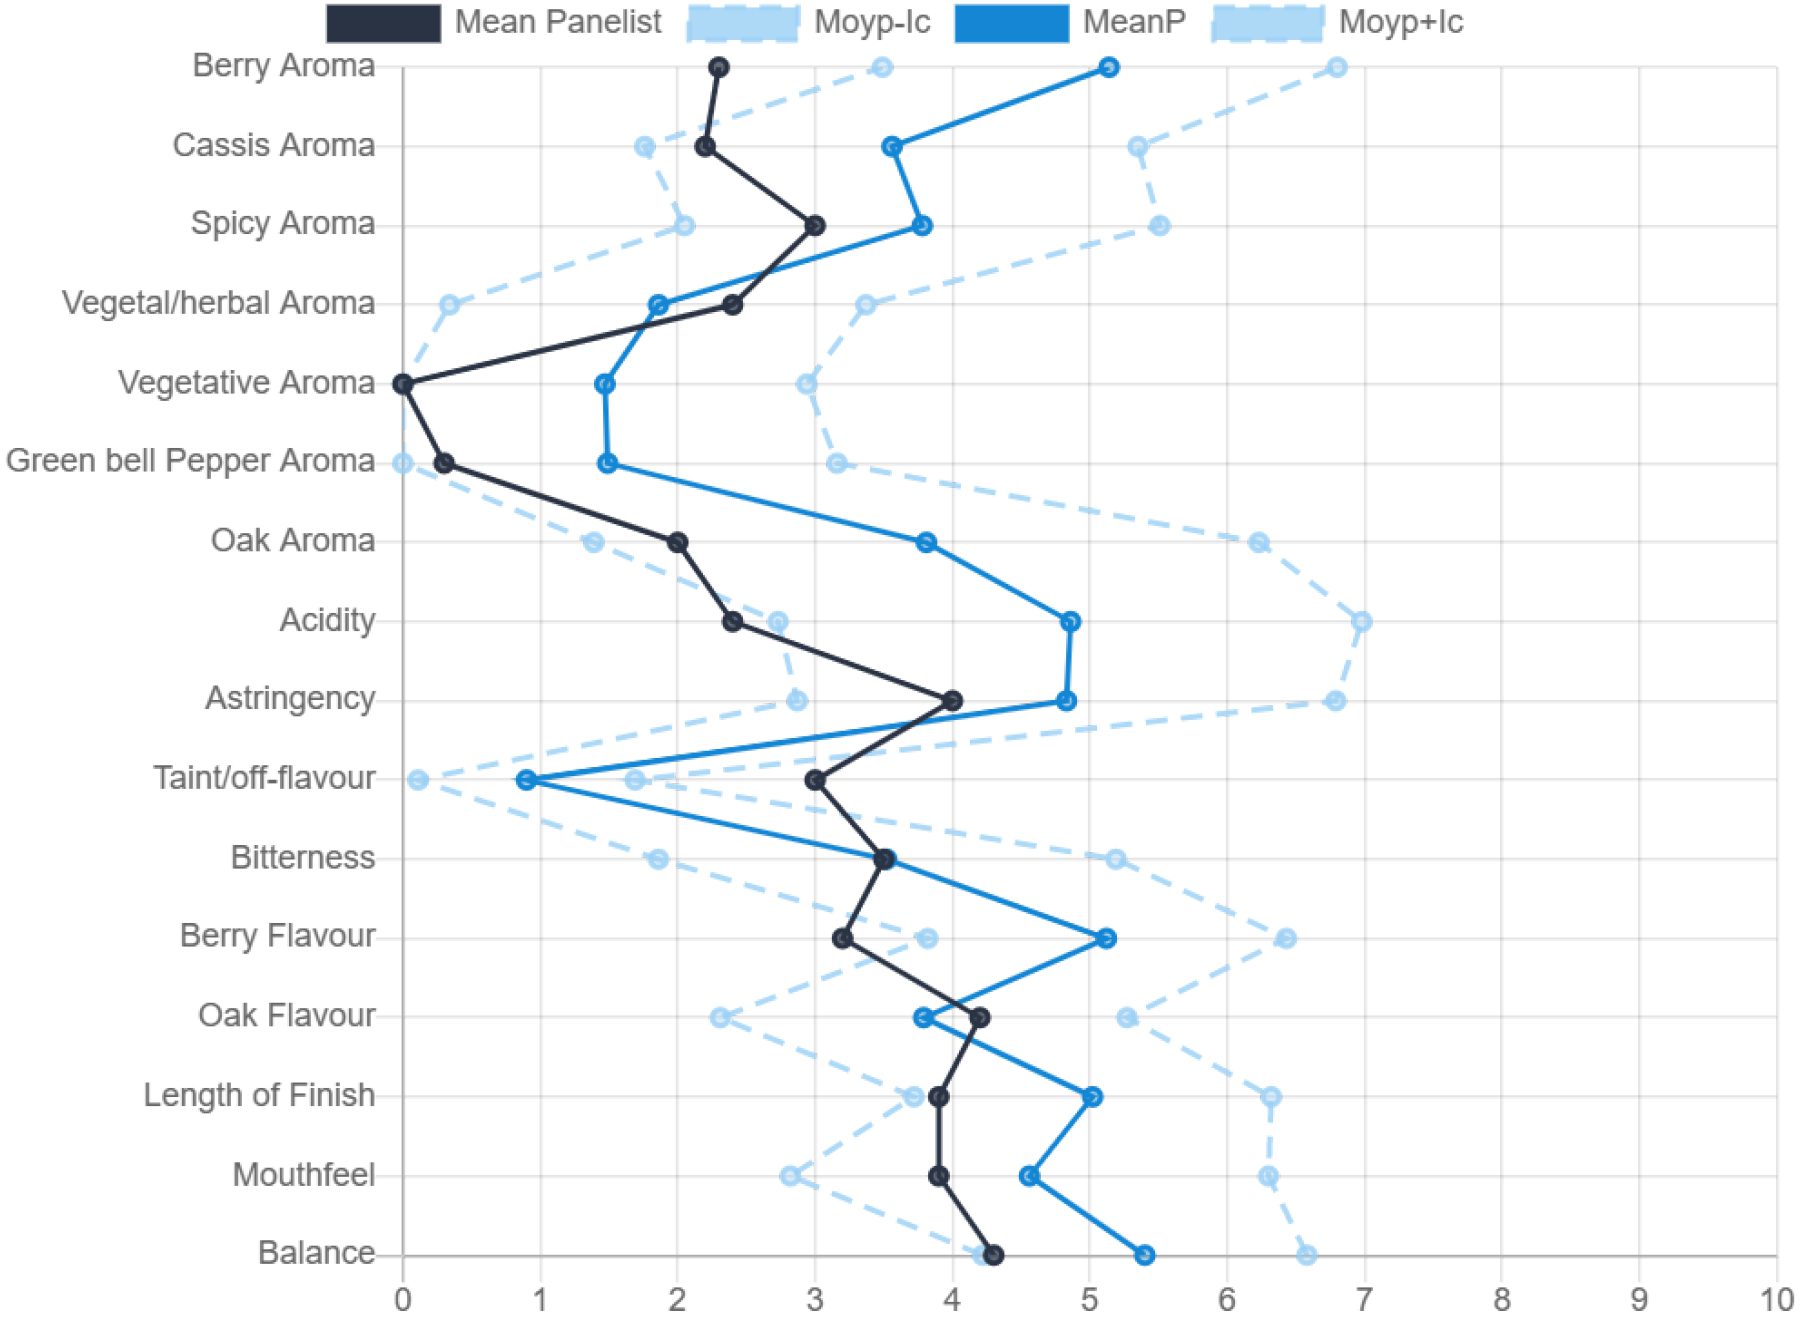
An overview of the judges’ sensory abilities can be obtained for individual products as shown in Figure 4. This graph is computed for one product evaluated by one judge. The confidence interval is computed at 95% on the panel mean. This is a common practice in sensory analysis. Such interval captures most panel scores (except for outliers) which can be removed from the data set. This panelist tends to use the lower part of the scale. Her score averages or means are below those of the panel. In some cases, her scores are outside the Confidence Interval (CI) denoting an outlier response such with the scoring of “berry aroma”, “berry flavor” and “acidity”. Given that 95% of the sensory scores fall within 2 standard deviations of the mean, the CI is large in our example because the panel is untrained. Depending on the complexity of sensory attributes, a trained sensory panel would display a CI about half the size as the one shown in Figure 4.
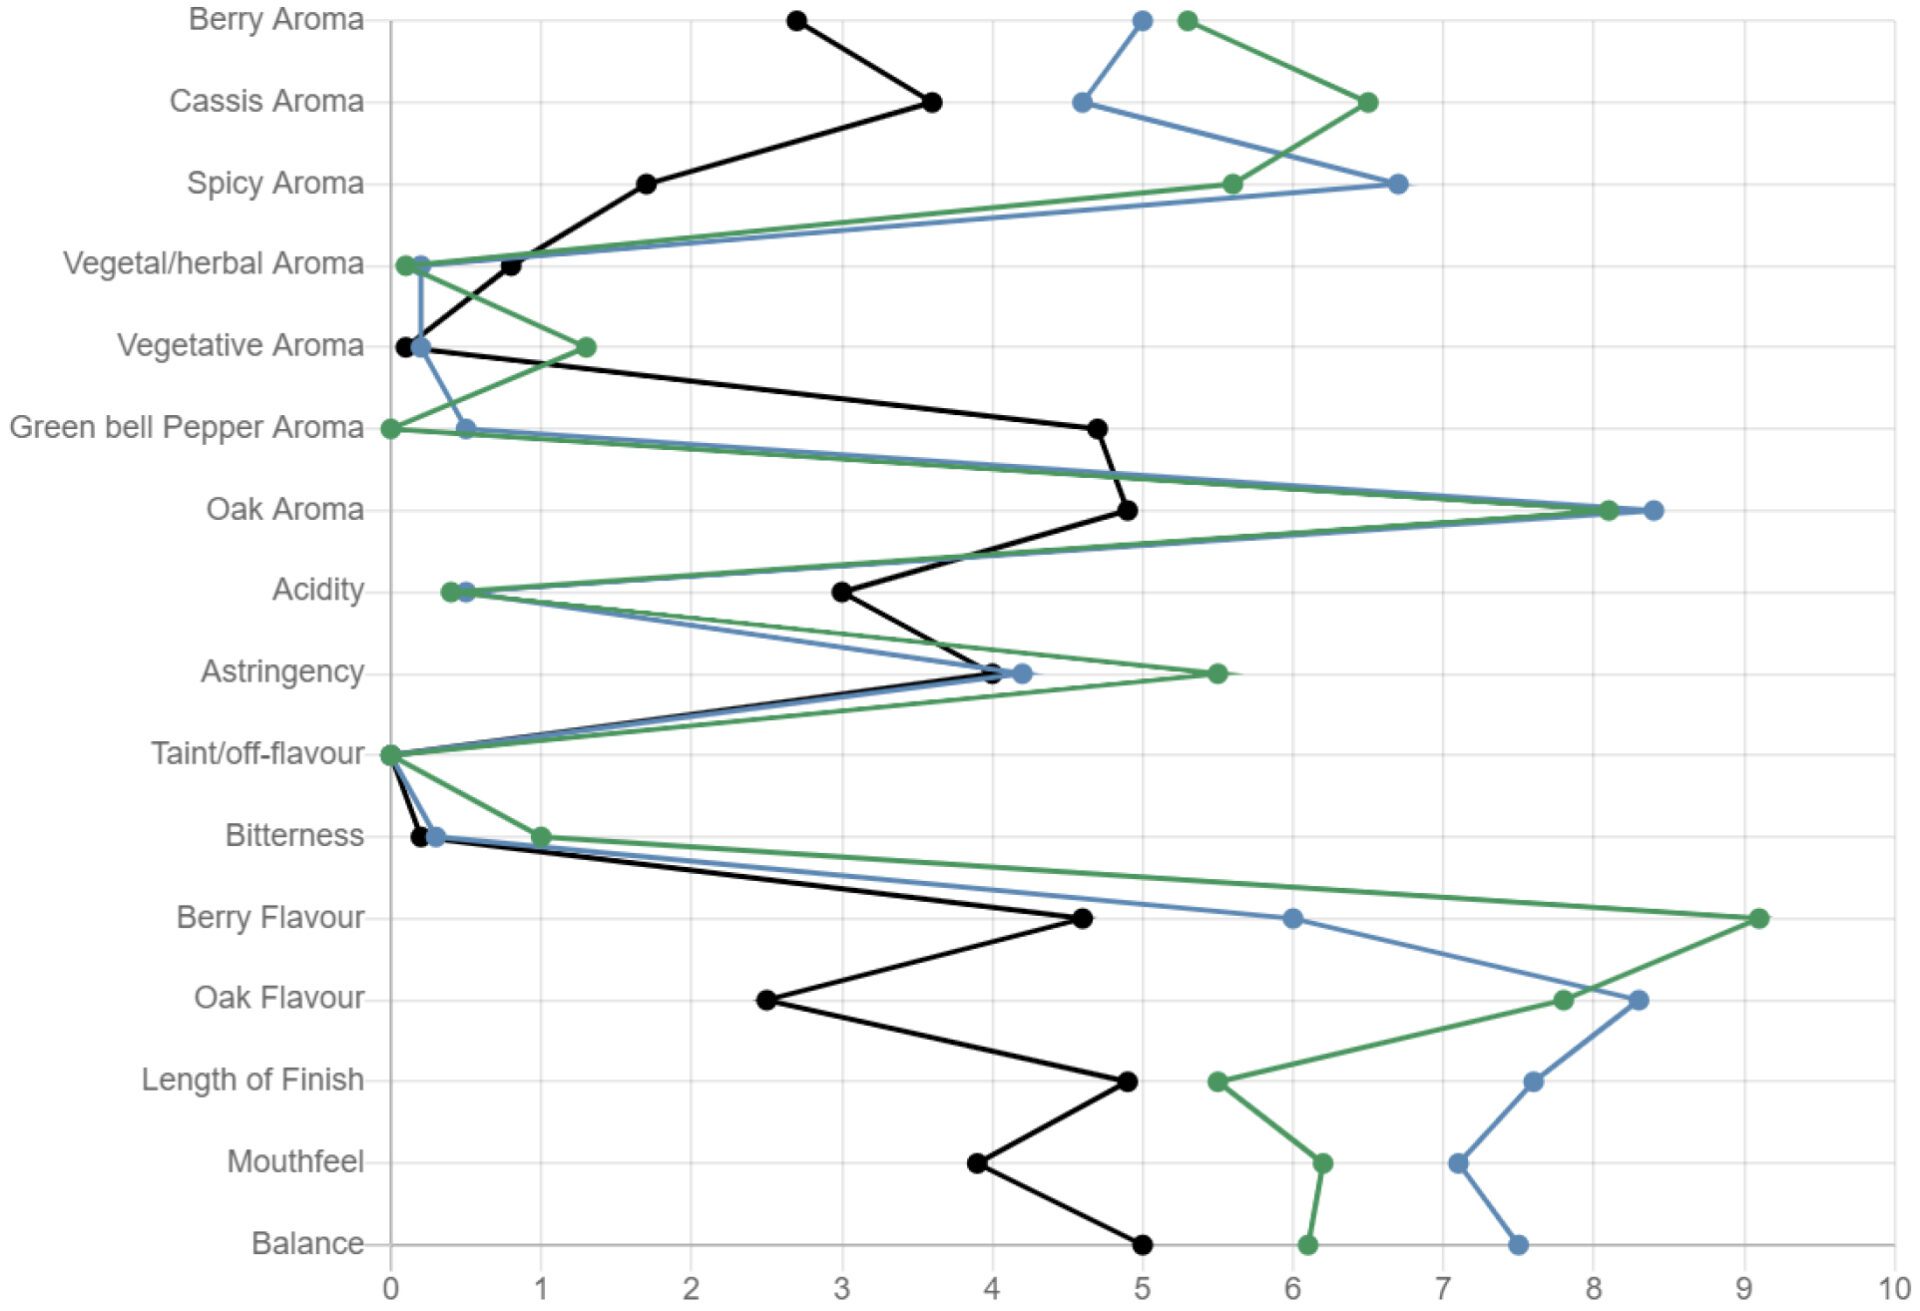
The graphing of all products’ sensory score averages can be obtained for each panelist individually (See Figure 5). This allows the panel coordinator to see whether the discrimination between products is high or low. Assuming products are sensorily different, curves that are close together will show little differentiation between products – panelist is not discriminant -, for low and high-intensity descriptors. In the example below, the 3 wines evaluated by the same panelist show different sensory profiles. The panelist doesn’t identify any defect. Yet, nuances in the level of bitterness and vegetal character are reported for all wines. Large differences are also noted for high-intensity descriptors (oak and fruit).
Repeatability
The product assessment would need to be replicated to gauge the panel’s reproducibility. The absence of statistical differences calculated through ANOVA tests (computed for p value of 0.05) would provide some confirmation that the panel can repeat an assessment of the same products reliably. Alternatively, dendrograms can be used to identify reproducibility amongst judges.
Sirocco Food + Wine Consulting promotes the Tastelweb® software for sensory analysis of food and beverages. Purchase individual tests and consulting services through our website. Tests include: Consumer Tests, Profiling/QDA®, Mapping, Triangle, and Pivot tests. Individual tests and bundles of 5 tests can be purchased through the store (no contract needed, technical support is provided by Sirocco and Tastelweb®). Sirocco Consulting and Tastelweb® will be exhibitors at the 15th Pangborn Sensory Symposium held in Nantes (France).