
Corrective and Preventive action (CAPA) is a continuous improvement tool that an organization uses as part of its Quality or Food Safety Management System to identify and eliminate or prevent causes of non-conformities (NC). It is defined as the systematic process of determining the root cause of existing product/process deviations in order to prevent their recurrence. When used in the context of a HACCP-based food safety management system, CAPA may be used to identify the reasons for the failure of controlling Critical Control Points (CCPs). More broadly, corrective action plans may be implemented in response to customer complaints, pre-requisite program deviations, non-conformities identified during food safety audits or regulatory inspections. Preventive action measures, on the other hand, may be taken as a result of a SWOT (Strengths, Weaknesses, Opportunities and Threats) analysis. Possible threats to business continuity could be the interruption of the production line due to crises such as a fire and supplier or labour issues.
To ensure that corrective and preventive actions are properly identified, implemented and validated as effective, the CAPA process follows the following four distinct steps:
1) Identification of Non-Conformity, Evaluation & Review.
2) Root Cause Analysis
3) Corrective/Preventive Action Plan
4) Verification of effectiveness
The rigorous investigation of the root cause of non-conformities (Step#2) is a critical step. For a robust root cause analysis to take place, the following tools may be use individually or in combination:
5-Whys
The 5-Whys is a Total Quality Management (TQM) technique that was originally developed by Sakichi Toyoda (1867-1930), the founder of Toyota Industries Co., Ltd. The tool is used as part of the application of Lean Six Sigma principles.
When used by a cross-functional group, the simple method guides the participants through the identification of the root cause of non-conformities by repeating the question “Why?” The narrative process is iterative in nature meaning that each answer to the “why did this happen?” question will form the basis for a new interrogation. It may take more or less than 5 questions to determine the root cause of a problem. It should also be pointed out that negative outcomes may derive from multiple sources that may have a cumulative effect. If the CAPA team identifies more than one path leading to the final outcome, the 5-Why method will be applied to all identified causes. Six Sigma experts stress that the protocol must be rigorously followed until the possibility of root causes is exhausted. Experienced practitioners will stop the questioning if a policy, a process or a person is identified. Experts also warn that, in some cases, practitioners will be unable to answer “why” due to a lack of understanding, expertise or familiarity with the product/process. This situation will require a more in-depth investigation where technical or process flow experts may be brought in from outside to help with root cause identification. We see that the key to a strong 5-Why exercise requires both discipline and knowledge. It’s also important that the technique lead to actionable results: the control of the identified and verified root causes must have a good probability to reduce or eliminate the non-conformity. Depending on the complexity of the problem, root causes may be prioritised so that an efficient action plan may be implemented.
Fishbone diagram (6Ms)
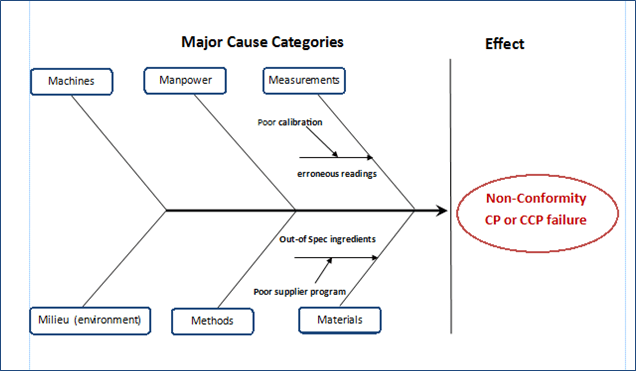
The Ishikawa diagram (also called fishbone diagram) is a cause and effect flow diagram created by Kaoru Ishikawa (1968). This visual tool finds applications in product design to prevent quality defects. It is also used more broadly as a Lean Six Sigma tool where potential factors compound to form an overall effect. The diagram allows visualisation of the source of variations or “deviations from requirements” that lead to the non-conformity. Brainstorming or the 5-Why method may be used to generate the diagram. To focus the analysis, root causes are usually grouped into major categories that are represented by “fish bones.” In a product manufacturing environment, categories typically include:
Manpower: People involved in the food manufacturing
Methods: Policies, procedures, work instructions, regulatory and customer requirements
Machines: Equipment, IT solutions required to accomplish the task
Materials: Raw materials and other inaids, Work-in progress, Packaging
Measurements: Data from instruments and computers
Milieu (Environment): The conditions (physical location, time/season, temperature) in which the food product is manufactured
These categories are referred to as the 6Ms.
Cause mapping
Cause mapping is a graphical tool that is widely used in project risk management. Similarly to the fishbone diagram, it provides a visual representation of the “chains of causality” but is not restricted to pre-defined root cause categories. It is best utilised for complex root cause analyses as it allows participants to visualise and expand long and interconnected cause-effect chains. As with other CAPA tools, cause maps may be reactive or proactive. The technique utilises the directed 5-Why method for cause-and-effect idea generation; the drawing of the map can also be achieved using brainstorming. In addition to asking “why?”, cause mapping also asks “What was required to produce this effect?” which guides the problem-solving process. Like with other CAPA techniques, potential root causes may be observed or measured and must be verified as valid. The relationship between two potential causes should not be overlooked. In some instances, 2 or more causes produce an effect only in combination. This can be represented by “AND” on the map. It takes good facilitators to guide participants through an in-depth CAPA exercise.
In a business environment, process or product non-conformities have a direct impact on company goals. When drawing the cause map, these impacts may be represented as overall effects. The cause-and-effect chains that derive from overall effects may be linked at any point on the map. The resulting visualisation may be used to identify critical root cause points where controls can be best applied to correct or prevent recurrence. Click here for an example of a ThinkReliability® cause map applied to a food recall.
References
Department of Health and Welfare – Idaho.gov
Project Risk Analysis and Management Guide, Second edition by John Bartlett (2004)
ThinkReliability – The problem solving discipline for your business