
In this sensory blog, we are featuring two cases studies to showcase the technical capabilities of Tastelweb©. The sensory applications under study comprise of a red wine and dark chocolate chips.
Triangle Test
The triangle test is a discriminative method that enables the comparison of two samples to determine if an overall sensory difference exists between two products. This test does not require expert assessors but it is used to screen potential panellists to assess their sensory acuity. This test is ubiquitous in the food industry to determine the effects of slight changes in product formulation or process on the sensory profile of a product. Tastelweb© follows the ISO 4120:2021 Sensory analysis — Methodology — Standard for the development of the Triangle test.
Case study #1 – Fair-trade Chocolate (Assessment of Chocolate Chips)
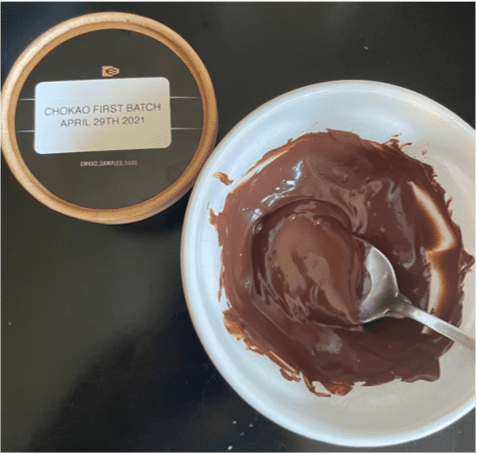
Our client, Emkao Foods, approached us to develop a sensory wheel for their organic, single-origin cocoa beans, cocoa nibs, and chocolate. Their fair-trade chocolate is made from 2 cultivars grown in Cameroon, Equatorial Africa: 60% Criolo and 40% Trinitario. The roasted cocoa beans have a robust flavour which is fruity, nutty, tannic and reminiscent of a chocolate brownie. Trinitario and Criollo cocoa are favoured in the making of high-quality dark chocolates.
Test Objective
As part of new product development activities, two production batches of Chokao dark chocolate chips were manufactured from roasted beans. Products were fully tempered. While the product formulation was the same for the two product lots, the manufacturing steps differed in the duration of the conching process. Conching consists of mixing over multiple days at high temperatures of the core ingredients (cocoa liquor, sugar, and cocoa butter) together and then finely grinding them and ensuring that all the solid particles are coated with fat. It’s a step that contributes to the development of the final flavour and to the smooth texture of chocolate (Aprotosoaie et al., 2016). The Emkao team wanted to identify whether the conching processes could significantly affect finished product quality.
Test Modalities
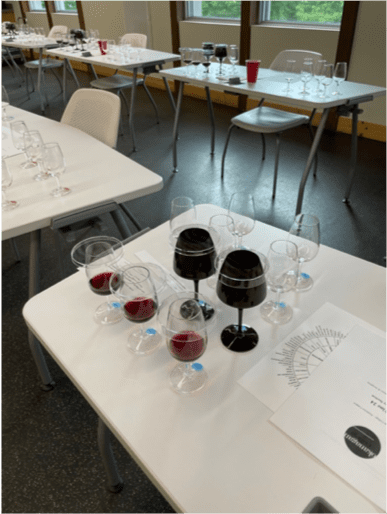
In this experiment, the sensory panel assessed blind two lots of chocolate chips in duplicates (4 assessors receive the samples twice blind).
Samples differed slightly in colour but were assessed under low light. The slight colour difference, therefore, didn’t affect the test. Sample presentation was fully randomized using 3-digit codes.
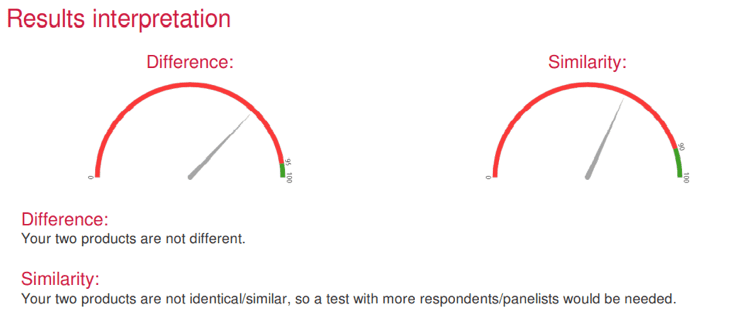
Conclusions
Only 2 panellists (with well-developed sensory acuity) out of 4 determined the correct answers twice in a row. We concluded that samples were not significantly different at the 95% confidence interval. Results also indicated that the samples were not significantly similar. A greater number of assessors must therefore be recruited to confirm the test results. In future, Emkao can use the triangle test to select panellists and to perform quick evaluations of product lots for quality control.
Note: while a small panel of 7 to 8 judges is adequate to obtain an accurate triangular test, we recommend that the test be conducted with 12 to 15 panellists to optimize test sensitivity and accuracy.
Case study #2 – Wine from British Columbia, Canada
Students from the Okanagan College Winery Assistant Certificate Program were introduced to sensory evaluation analysis. Their sensory acuity was tested using a triangle test methodology. Neutral red wine was used for this test as well as a sensory reference compound reminiscent of asparagus/green bell pepper. The compound (2-isobutyl-3-methoxypyrazine) was added at a concentration that was set at the middle of the detection threshold range (10–16 ng/L).
List of Products
- Product A: Neutral red wine (spiked with Aroxa reference – 2-isobutyl-3-methoxypyrazine – Capsicum/Green Bell Pepper) (Coded 426 and 247)
- Product B: Neutral red wine (standard) (Coded 507 and 570)
- 3 ISO type glasses covered with petri-dishes to concentrate aromatics in the product headspace.
Modalities
- Number of respondents/panellists: 10
- Number of correct answers: 7
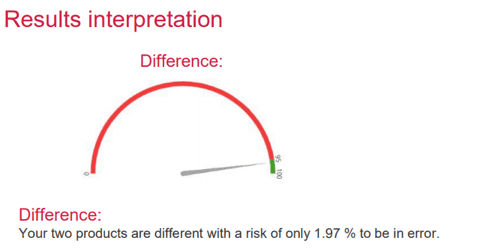
Default Confidence Interval: 95%
Difference alpha risk: 1.97 %
Similarity beta risk: 82.81 %
Conclusions
All but three students were able to detect a sensory difference and picked the correct sample. Some participants were also able to name the sensory differences between the wines.
Panellists’ Comments:
- Two samples smelled like green pepper-like cab franc.
- The other two samples had a note of green pepper that I did not find in the odd sample.
- The aroma was a key indicator – peppery notes on the nose. Then followed by the taste of some vegetative notes, and green pepper.
- I noticed an aroma of green pepper.
Food Profiling/QDA®
Quantitative Descriptive Analysis (QDA®) is a robust sensory profiling methodology. QDA® was developed by Tragon Corporation in collaboration with UC Davis. When implementing sensory profiling and QDA® methodology, expert panellists (or judges) perform multiple product evaluations by rating the intensity of sensory descriptors using linear scales. The methodology is most effective when the panellists enjoy a good consensus regarding the sensory descriptors under study.
Statistical analysis makes it possible to determine panellist performance and to quantify sensory differences amongst samples. QDA® results are often graphically represented such as on a spider graph or PCA plot. Tastelweb© follows ISO standards for the development of the Food Profiling/QDA®test: ISO 13299:2016 Sensory analysis — Methodology — General guidance for establishing a sensory profile and ISO 8587:2006 Sensory analysis — Methodology — Ranking.
Case study #1 – Fair-trade Chocolate
Test Objectives
Since the triangle test identified near-significant results between the two product runs of dark chocolate, a profiling session was conducted to identify key sensory specifications. A panel of 4 tasters (with good sensory acuity) evaluated the samples. A commercial brand of semi-sweet chocolate chips was added to the list of samples as a baseline.

Test Modalities
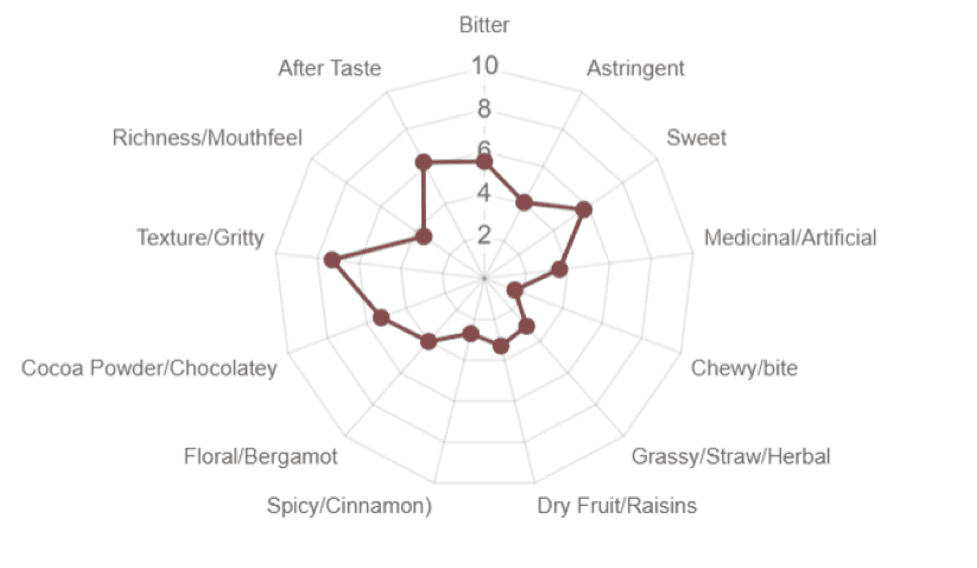
The chocolate samples were evaluated against 13 attributes picked from a proprietary chocolate aroma wheel. Attributes are shown on the spider graph. Intensities of perception were recorded using linear scales anchored between 0 and 10 (0= no perceived intensity, 10= very strong perceived intensity).
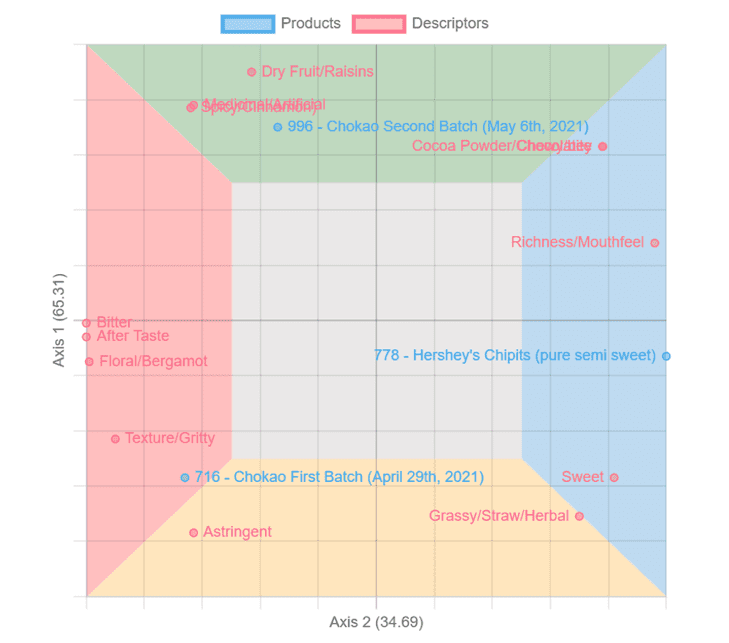
A Principal Component Analysis (PCA) plot was generated from the raw sensory data. The plot identifies products and descriptors. Products that are close together on the map share similar sensory profiles. Products that are far apart have a different aroma, flavour, and taste profile. A sample can be defined by the sensory attributes closer to it.
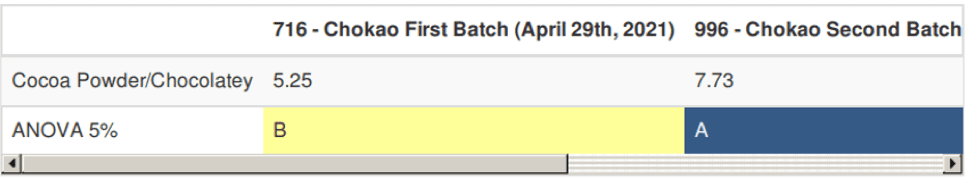
For significant attributes, mean comparison tests were performed using ANOVA (5%). Cocoa/chocolate flavour of the finished product was identified as a significant attribute: the second batch of chocolate was perceived more strongly for this attribute (7.73/10 versus 5.25/10).
Conclusions
The sensory evaluation identified that the length of the conching process had an important impact on the sensory flavour of the dark chocolate (Emkao used the same recipe and same equipment to manufacture both batches). The PCA plot allows the instant visualization of the sensory profile of the two prototypes against that of a commercial reference.
As the Emkao sensory panel gets trained on recognizing and rating sensory attributes, they will be able to generate accurate sensory profiles of chocolate samples which will support quality control and marketing/sales activities.
Case study #2 Wine from British Columbia, Canada
Test Objectives
The OC students were introduced to sensory profiling and evaluated blind 3 red wines that were donated to the program. The three wine samples were made from grapes grown in British Columbia. The wines were assessed against the following 16 attributes: Berry Aroma, Cassis Aroma, Spicy Aroma, Vegetal/herbal Aroma, Vegetative Aroma, Green bell Pepper Aroma, Oak Aroma, Acidity, Astringency, Taint/off-flavour, Bitterness, Berry Flavour, Oak Flavour, Length of Finish, Mouthfeel and Balance.
Test Modalities
- Number of panellists who participated in this test: 10 wine students with good sensory acuity.
- Number of assessed products: 3 donated red wines manufactured in British Columbia.
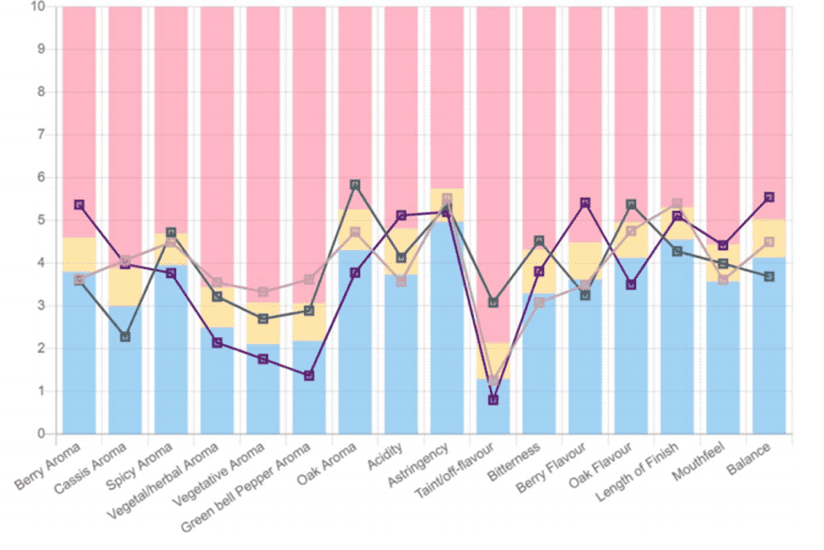
Tastelweb© graph – 3 red wines manufactured from grapes grown in British Columbia (Canada) were assessed blind by a panel of 10 students. Assessment included 16 sensory descriptors (aroma, flavour, taste, mouthfeel).
Conclusions
Students from the Winery Assistant Certificate Program were introduced to sensory analysis methods which were applied to red wine. Tastelweb© was used to compare two wine samples in a triangle test and three red wines in a Profiling/QDA© test. This case study demonstrates how sensory data can be quickly captured and graphed to support the quality and marketing/sales activities in a winery or beverage facility. Tastelweb© also offers a Sensory Panel Performance Tool that can be utilized by the sensory panel coordinator to ensure data accuracy and the need for retraining.