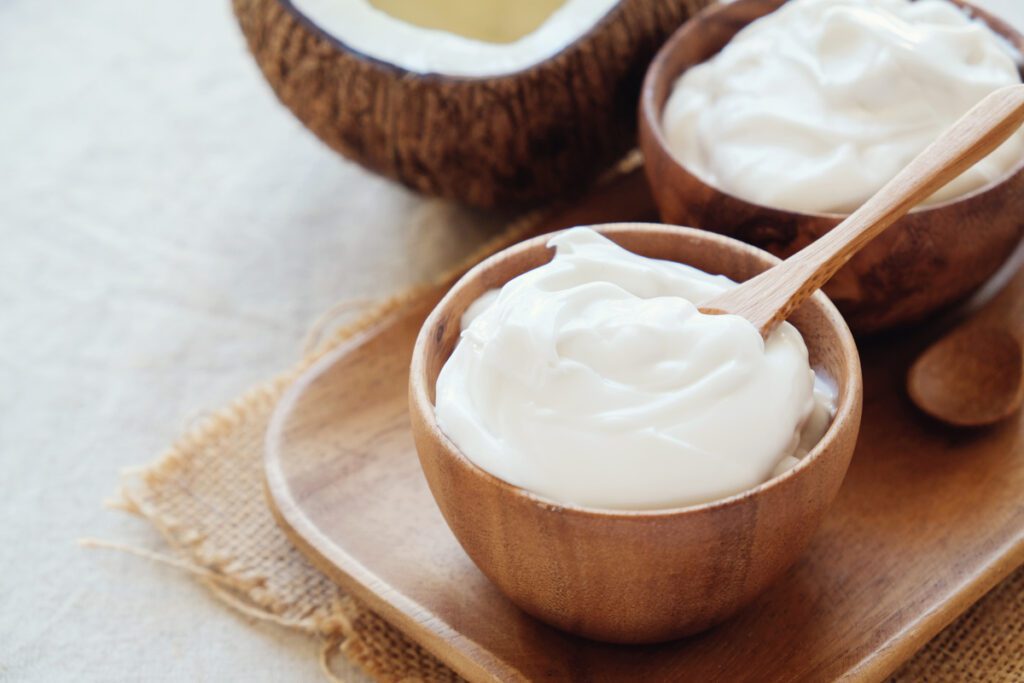
The BC Institute of Technology collaborated with Tastelweb to allow students to complete a sensory evaluation of plant-based yogurts using sensory software. Vegan yogurts are popular with consumers who have allergies or sensitivities to dairy or those who choose to consume vegan food.
The products that were evaluated by the students for this study were commercialized. The goal of the project was to compare the sensory profile of yogurts to identify key descriptors that explain variations in the product sensory profiles. This information is useful for research and development, sales, and marketing teams. Two tests were employed for this study, a QDA test and a Pivot test. The students were organized into two teams, and their instructor participated in the tastings as panelists. Two students were appointed as project leads and acted as panel coordinators, while an additional instructor trained in sensory analysis supervised the project.
The project was limited to class time. The profiling exercise included a quick review of the different yogurts. Attributes, few in number, were selected based on texture and taste mainly. The selected 12 descriptors were: Smooth, Viscosity, Pungent, Creamy, Thick, Chalky, Starchy, Sour, Sweet, Metallic, Sour (after taste), and Sweet (after taste). The student panelists had a limited amount of time to train on the descriptors. Quantitative Descriptive Analysis (QDA) usually requires extensive training to facilitate the recognition of selected sensory attributes and their quantitative assessment using intensity scales. In comparison, the Pivot Test (exclusive to Tastelweb) is a new profiling methodology based on free comments from panelists. Tasters must be familiar with the product sensory space and ability to describe the positive and negative sensory attributes using a rich vocabulary.
Tastelweb Sensory Tests
Graphical outputs and results
A dendrogram of the hierarchical clustering of sensory attributes was generated for the QDA study. The graph shows that there is variability amongst the 6 products studied. Groupings of products are also identified.

Figure 1 – Dendrogram of 6 plant-based products (Tastelweb)
A sunburst diagram or spider graph (See Figure 2) provides further insights as to the degree of differences for the 12 attributes (sensory scale anchored from 1 (low intensity) to 10 (high intensity). We see that yogurts vary according to the level of perception of starchiness, thickness, creaminess, sourness/pungency, and chalkiness. Since these key descriptors are related to the degree of preference and acceptance of the yogurts, knowing how to increase or decrease their perception will have an impact on sales and repeat purchases. We also note that the aftertaste can be quite sour for some products, therefore the sensory evaluation must be conducted over a defined period of time to capture maximum information.

Figure 2 – Spider diagram (QDA sensory test, Tastelweb) of 6 plant-based yogurts (last two attributes relate to the aftertaste of the product).
The least square differences were automatically calculated by the software using a Friedman Test (non-parametric test). See Figure 3. This test identifies which yogurts are statistically different in the perception of starchiness.
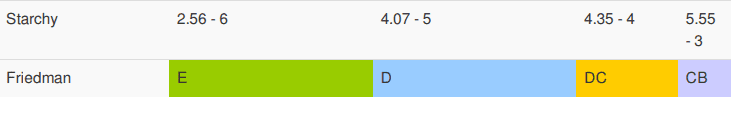
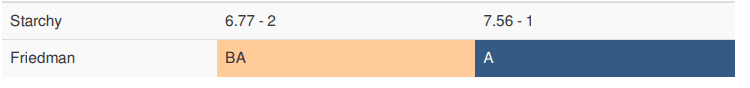
Figure 3 – Least square differences (Friedman test) calculated for 6 plant-based yogurts under study. Products are assigned colours, and products that share letters are similar for the perception of the starch attribute.
The Pivot test, in comparison, yielded a different group of descriptors based on the free comments. Panelists who were familiar with the product sensory space used their own words to describe the yogurts. A semantic review of the terms led to the identification of key descriptors such as: sour, sweet, creamy, coconut, nutty, grainy, white, starchy, milky, watery, and smooth.
We note that the free comment method provides a richer group of terms to describe the products. Appearance and flavour are key attributes included in the analysis based on the panelists’ feedback. When frequencies for these terms are tabulated, a sensory profile of each product is revealed as shown in Figure 4. The example shown describes a product that is mainly sour, starchy with a grainy texture and low sweetness. Yogurts can also be compared for key attributes (data not shown).
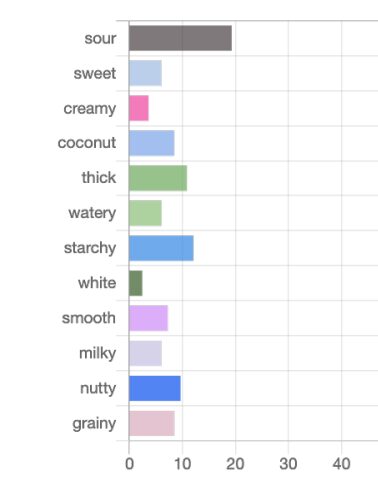
Figure 4 – Sensory profile of a commercial plant-based yogurt (pivot test – Tastelweb).
The students compared the results from the two sensory tests which shared common food products. Overall, the key descriptors such as sourness and sweetness were well identified and rated using both methods. Since the students lacked time to train on the use of intensity scales for notable sensory attributes, they recommended using the Pivot test as a quick method to pinpoint key descriptors which could then be studied further in a QDA test.
References:
Tastelweb sensory software
Sirocco Food + Wine Consulting – Sensory Evaluation of food and wine
Interested in sensory evaluation? Contact Sirocco Food + Wine Consulting for a free demo of Tastelweb software.